Reports
Report Categories
There are four categories for reports:
| Category | Description |
|---|---|
| Workload | View how much work everyone has and reassign tasks as needed. |
| Summary | Show an overview of a project along with a pie chart. |
| Productivity | Track the amount of work that has been done over time along with a bar graph. |
| Other | Miscellaneous reports that include progress reports and job tasks reports. |
General Interface
Reports allow supervisors, directors, and producers to analyze data and progress through a variety of customizable tables.
You can navigate to this section by selecting “Reports” in the top menu.

By default, the page will bring you to the “Add Report” section. You can choose to select an existing report from the sidebar or continue creating a new one.
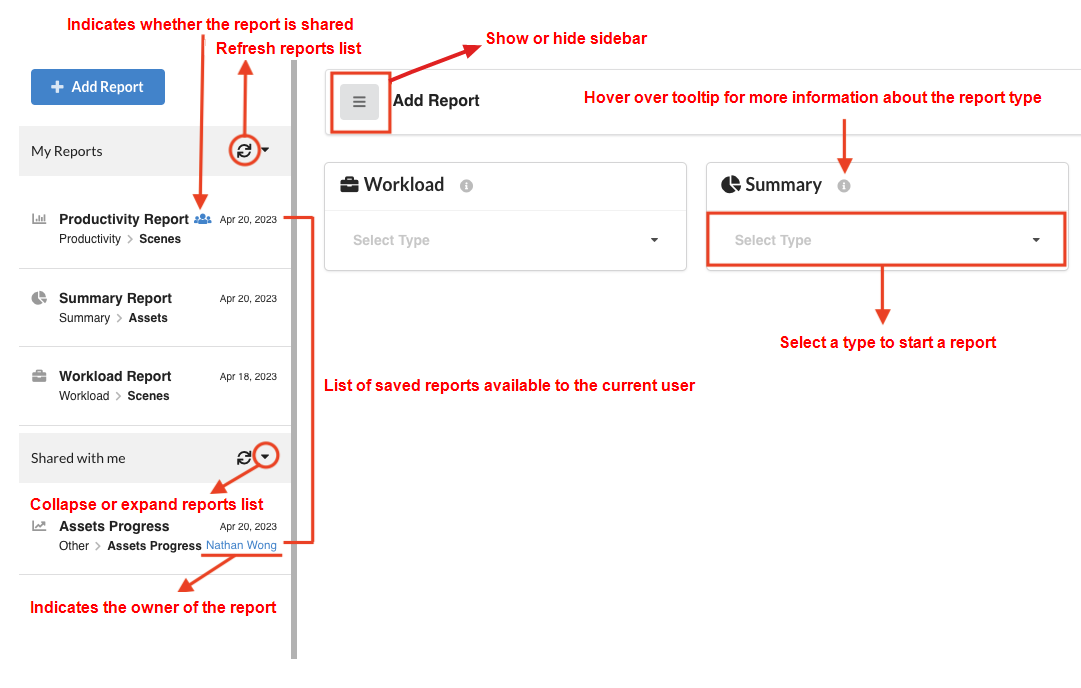
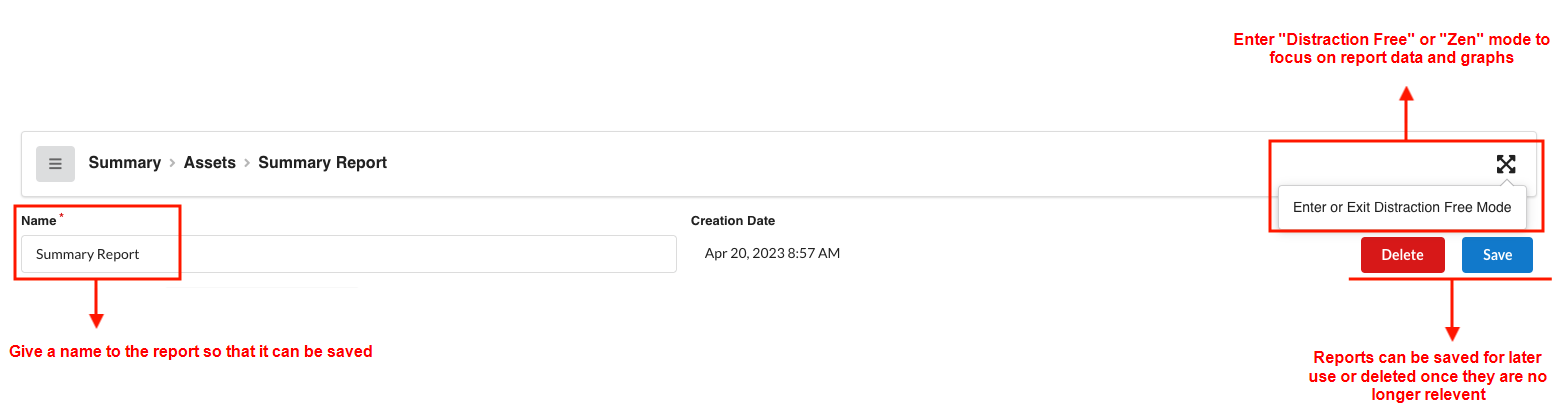
Once a report is generated, it is possible to save it for later and share it with other people.
You may also choose to display only the data table and graphs for the current report, a mode known as the “Distraction Free Mode”, by pressing on the four-arrows button.
-
From the left panel, click on the “+ Add Report” button, to clear any previous reports that may be displayed.
 NOTE You may hide the sidebar, to maximize the report area. You can always bring it back later, the same way you are hiding it, by clicking on the “Show or hide sidebar” button (the “burger” icon).
-
From one of the drop-down boxes, select the type of report you are interested in. For example, in the workload reports, you can choose from “Scenes” or “Assets”.

-
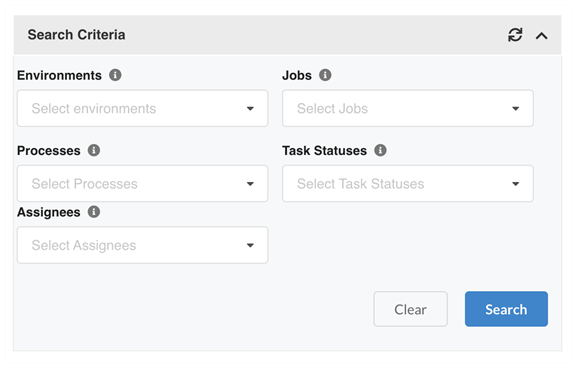
From the “Search Criteria” section, restrict the search to your liking. You can choose to focus on a specific criteria or a combination of them. Press the “Search” button when you are ready to proceed.
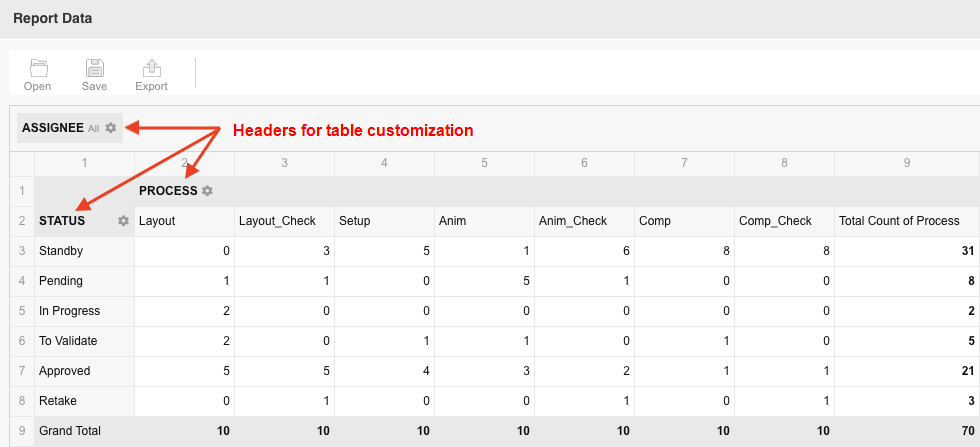
Once a report is generated, it is possible to filter its data without using the Search Criteria (which would fetch new data from the database). This can be done using the gear icon next to any of the headers.
These headers can be dragged and dropped within the table to customize its navigation.
-
For example, you can choose to display data for specific assignees in Summary and Productivity reports. To do this, click on the gear icon for “Assignee”
-
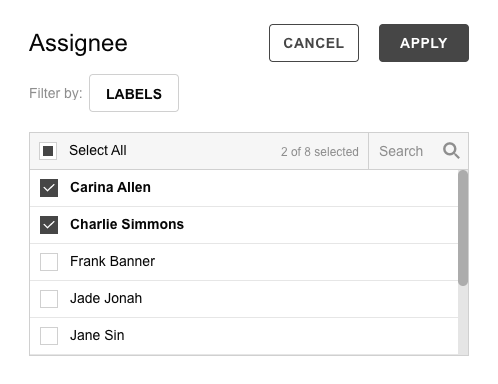
From the list of assignees, select the ones whose numbers you would like to see. For example, let’s look at the data for Carina Allen and Charlie Simmons. Click “Apply” to confirm the filtering.
-
Note how the “Assignee” header now has a funnel icon to indicate that it is being filtered.

-
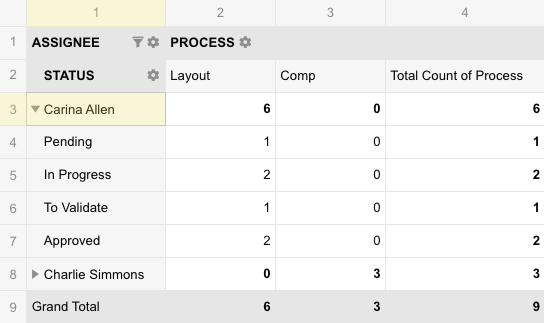
Now, drag the “Assignee” header to the top of the first column. An arrow icon appears and can be expanded to view the custom data.
In this example, each assignee can be expanded to view the number of processes in each status. You can see that “Carina Allen” currently has two “Layout” tasks in progress and one to be validated.
All Producer reports can be customized. As an example of customization in the Workload reports, we will choose to add the number of frames to the number of tasks and we will use conditional formatting to highlight higher tasks numbers. We will then save this report so it can easily be reused at a later time.
-
After generating a report, click on the “Fields” icon at the top right of the Report data section. (Note that this icon does not appear in the “Distraction Free mode”)

-
From the All Fields list on the left, drag the “#Frames” into the “Values” box at the bottom right. Click Apply.
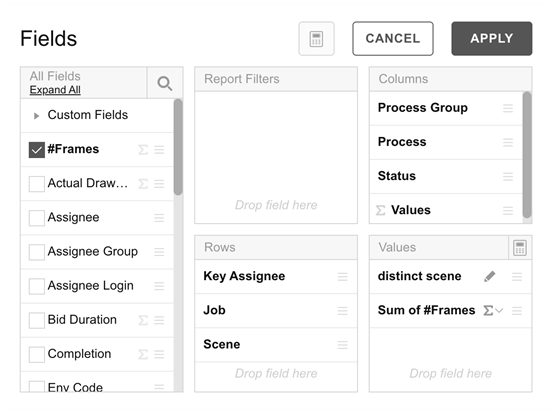
The Report data now shows the number of frames next to the number of tasks.
-
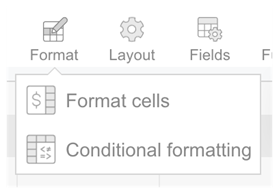
Now, click on “Format” and then “Conditional Formatting”.
-
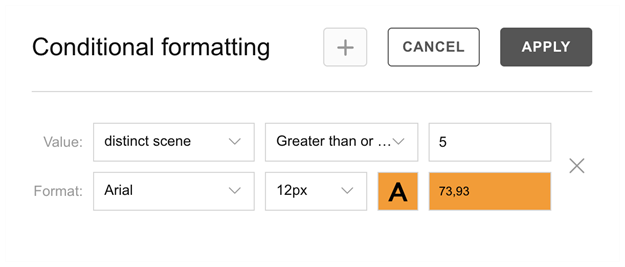
Click on the “+” icon to add a condition.

-
On the first line, for “Value”, select “Distinct scene”. Then select “Greater than or equal to” and enter the number “5”.
-
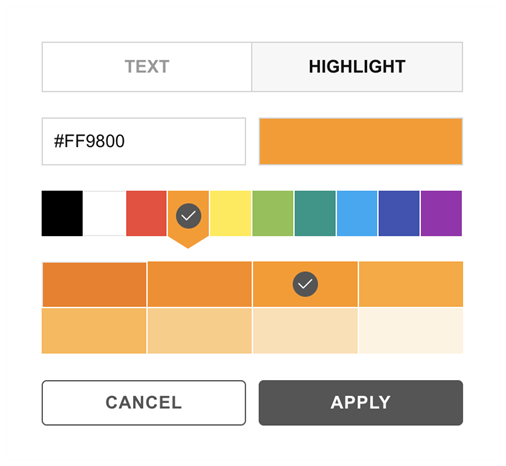
Next, click on the letter “A” to configure the format. For this example, click on Highlight, select the colour orange and click Apply.
-
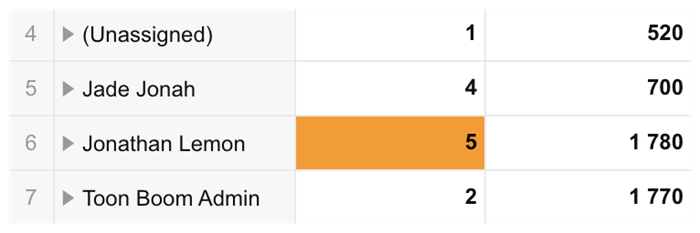
Click Apply to confirm the conditional Formatting. Number of tasks greater than or equal to 5 are now highlighted, making it easy to spot a heavy workload.
- To save this report for usage at a later time, simple fill in the report name and press the "Save" button at the top.
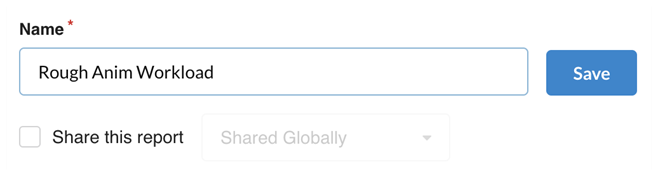
The report will now appear in your list of reports in the sidebar. It has been saved with your customization.
-
After creating or selecting a report, select the option “Share this Report”.
-
Click the “Save” button.
The report can be shared globally, to a specific user or group of users.
Shared reports will be displayed in the left panel under the section “Shared with me”
This procedure will allow you to export the data locally so that you may use it in another software, such as a spreadsheet editor.
-
After having created a report, scroll to the “Report Data” section.
-
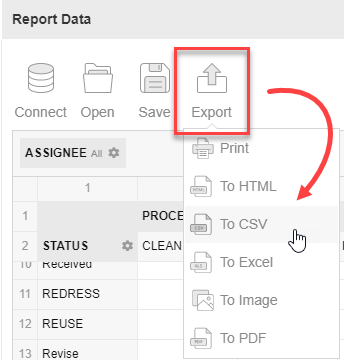
In this section, hover over the “Export” button to display a list of export options.
-
Click on one of the options to download the report data.
For example, clicking on “To CSV” will download a .csv document containing all the data currently displayed.
A .csv document downloads.