About Gantt Charts
A Gantt chart is available from the Production page under All jobs of any environment. It can be displayed by switching layout type along List and Tiles views.
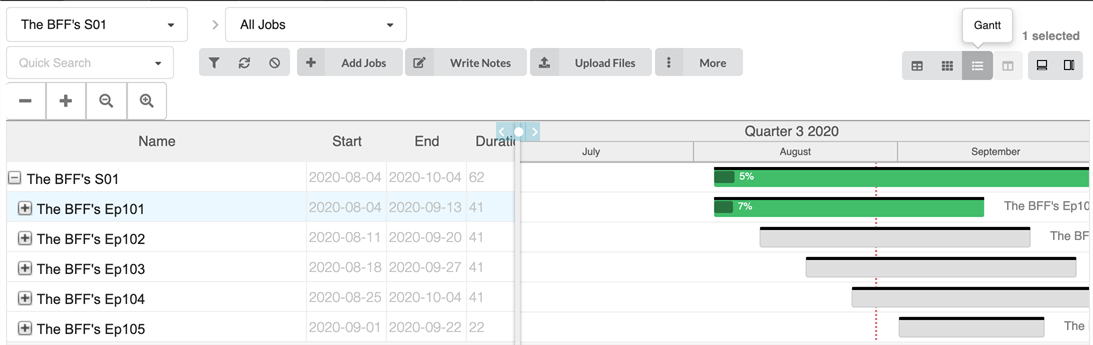
The Gantt chart lists all current jobs and their tasks for the selected environment. It can be collapsed to have an overview of when jobs should start and end over time or it can be fully expanded to display all tasks for every job. Every row displays the name, duration (in days), start and end dates for the environment, it’s jobs and all tasks from their workflow.
On the right side, there is a timeline and progress bar for each row, it will turn from grey to green when tasks start getting approved or completed. There is also a completion % that indicates the progress for each task, every job and the environment itself.

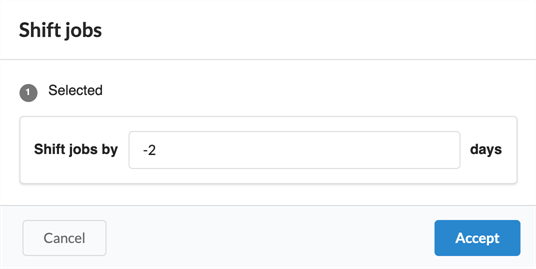
If a job needs to be shifted over in time, simply highlight the desired job and click on More in the menu above the table, then select Shift Jobs. In the Shift Jobs window, simply select the number of days it will be shifted over (jobs can be shifted in the future or in the past, using positive or negative values).