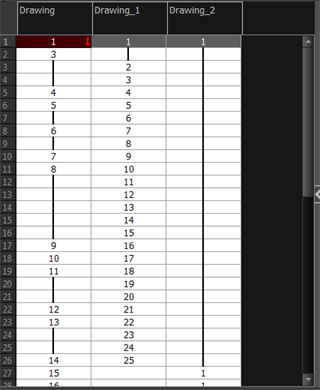
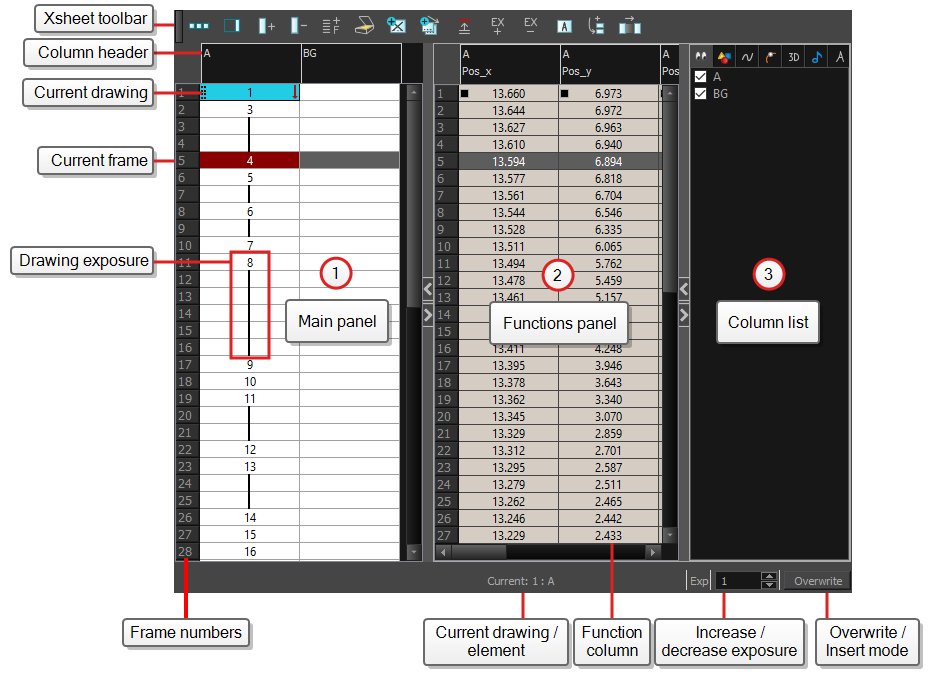
The Xsheet view lets you read the timing vertically by displaying it in a grid, with each drawing layer represented by a column, each frame of your scene represented by a row, and each exposed drawing displayed by its name in the cells. It is meant to work like a traditional animation exposure sheet.
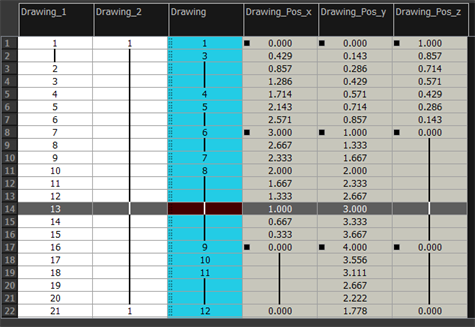
Using the functions panel, you can also view the functions and keyframes of the motion paths for the selected column, with the value of those functions for each frame listed in the cells.
Contrary to the Timeline view, the Xsheet view does not display pegs, effects or layer hierarchy. Hence, it is optimized for traditional and paperless animation, whereas the Timeline view is optimized for digital or cut-out animation.
Do one of the following:
- From the top menu, select Windows > Xsheet.
- From any of the other views, click the Add View
button and select Xsheet.
| Icon | Section | Description |
|
View Toolbar |
The view toolbar contains all the tools and options you can use in the Xsheet view to manage columns and timing. |
|
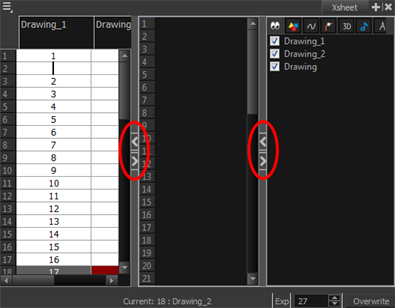
| Xsheet Main Section | The Xsheet view has three sections. By default, only the main section is visible. It displays the drawing layers, also known as drawing columns.
When using advanced compositing and animation techniques, unconnected functions (motion paths) also appear in the main section. Unconnected functions mean that some motion paths are not attached to any particular layer. When you reconnect functions to a layer, they are still visible in the main section.
|
|
| Functions Section |
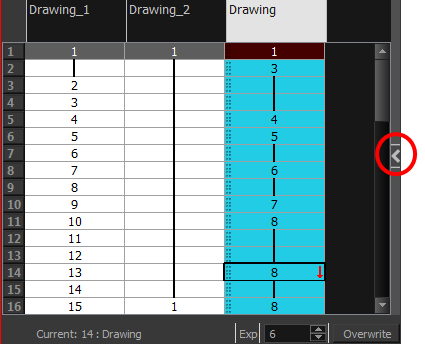
The Functions section is used for more advanced techniques. This section displays the functions (paths) related to the selected layer in the Timeline view. By default, the Functions section is hidden. In the Xsheet view, click the Expand button located on the right side of the main section. Click on the same button to collapse it. You can also use the Show Column List button in the Xsheet View toolbar. If you select a drawing column in the main section of the Xsheet view, the function columns will not be displayed. You must select the layer from the Timeline view.
|
|
| Column List Section |
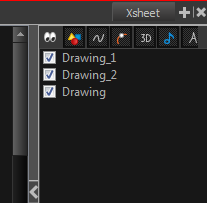
The Column List section allows you to show and hide columns in the Xsheet view. When you hide a layer in the Xsheet view, it is also disabled in the Timeline view.
You can use the Column List to hide individual columns or hide an entire column type (drawing or function) from the Xsheet view. By default, the Functions section is hidden. In the Xsheet view, click the Expand button on the right side of the main section to show the Functions section. Click on the same button to collapse it. You can also use the Show Column List Go to the Xsheet view menu and select View > Show Column List. Click the Expand button on the right side of the Functions section to display the Column List section.
|
|
|
Column Header |
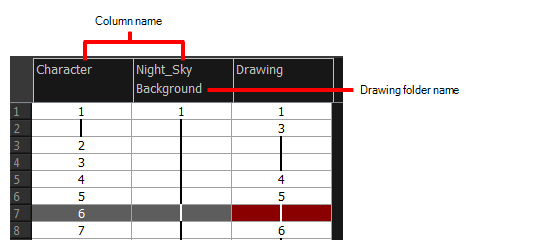
Each column available in the Xsheet view has a header displaying the column’s name. The column’s name is the same as the corresponding timeline layer. If you rename one or the other, they will both be renamed. A quick access menu is available when you right-click. This menu contains the command affecting an entire column such as renaming, changing the default colour, or deleting a column. The tooltip that appears when you hover at the top of each Xsheet column shows the folder path to the source drawings for that column.
In Harmony, the column header shows the layer’s name and the name of the drawing folder to which it is linked. If the name of the layer is the same as the drawing folder, the drawing folder’s name will not be displayed. To modify the name of the element folder independently from the column and layer name, you must select the Advanced Element Mode option preference in the Advanced tab of the Preferences dialog box.
|
|
| Current Drawing |
A drawing selected in dark red indicates that the drawing is currently displayed in the Drawing and Camera views. The current drawing selection is not linked to the drawing displayed in the Camera view since drawings from each visible layer are displayed at once.
|
|
|
Current Frame |
The darker frame appearing in the Xsheet view represents the current frame.
|
|
|
Drawing Exposure |
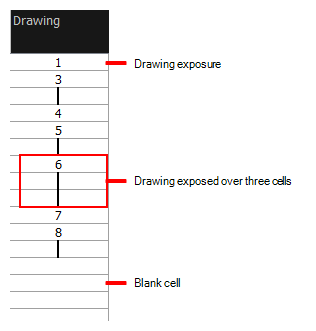
In the drawing columns, you can see the drawing names and their exposure. You can use any alphanumeric symbol to name your drawing. When a drawing is exposed over more than one cell, a vertical black line is displayed to indicate the continuity of the exposure. When there is no drawing in a cell, the cell will be blank.
|
|
|
Frame Numbers |
On the left side of the Xsheet view, the frame numbers are shown indicating where you are. These read vertically instead of being displayed horizontally as they are in the Timeline view.
|
|
|
Current Frame Display |
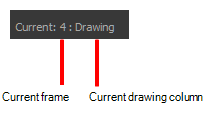
At the bottom-right of the Xsheet view, you can see the current frame number, as well as the column containing the drawing currently displayed in the Drawing view.
|
|
|
Functions Column |
The functions columns are displayed in the Functions section of the Xsheet view. They represent the motion and rotation you applied to a drawing layer. A function column can also be related to an effect. Selecting the effect layer shows you the corresponding function column in the Xsheet view. The function columns display the position value or effect value on each cell. If there is a keyframe on a cell, a black square is displayed. Holding the same value for several frames displays a vertical black line.
|
|
|
Increase/Decrease Exposure |
You can quickly increase or decrease the exposure of the selected cell by clicking on the up and down arrows in the Increase/Decrease Exposure field.
|
|
|
Overwrite/Insert Modes |
The Overwrite/Insert button allows you to decide the way the values are inserted into the Xsheet. |
