You can display a parameter's function curve and adjust the easing with the relevant controls.
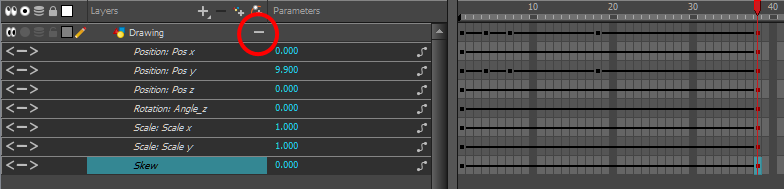
- In the Timeline view, click the Expand
 button on a layer or press Alt + F.
The layer’s functions are displayed.
- Double-click the desired function. Note that 3D Paths have a specific velocity curve controlling the X, Y, and Z axis together. You need to click on the
Position:Velocitylayer.
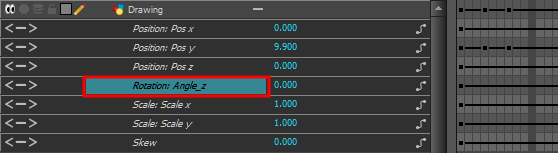
The Function Editor opens as the


The editor will not be displayed if the function does not already exist.