Modifying a Path in the Function View
If you are accustomed to using graphs and function curves, you can use the Function view to define trajectories.
The graph in the Function view displays the motion over the first and last keyframes set in the scene, as well as any keyframes created between. If the scene is 60 frames, but the character's motion ends at frame 40, then the editor will only display up to frame 40.
The Function view lets you edit function curves and parameters. It is a visual graph for adding, removing, and editing keyframes, as well as adjusting the velocity. The Function view allows you to display multiple functions in the background as a reference.
- Open the Function view.
The Function view is blank until you select the layer containing the functions you want to display.
- To display a function in the Function view, click on the layer containing the functions to adjust in the Timeline view.
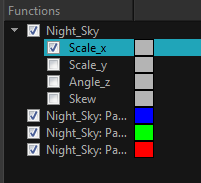
- To select the functions you want to edit, select them in the Function list.
| Parameter | Description |
|
Function List |
|
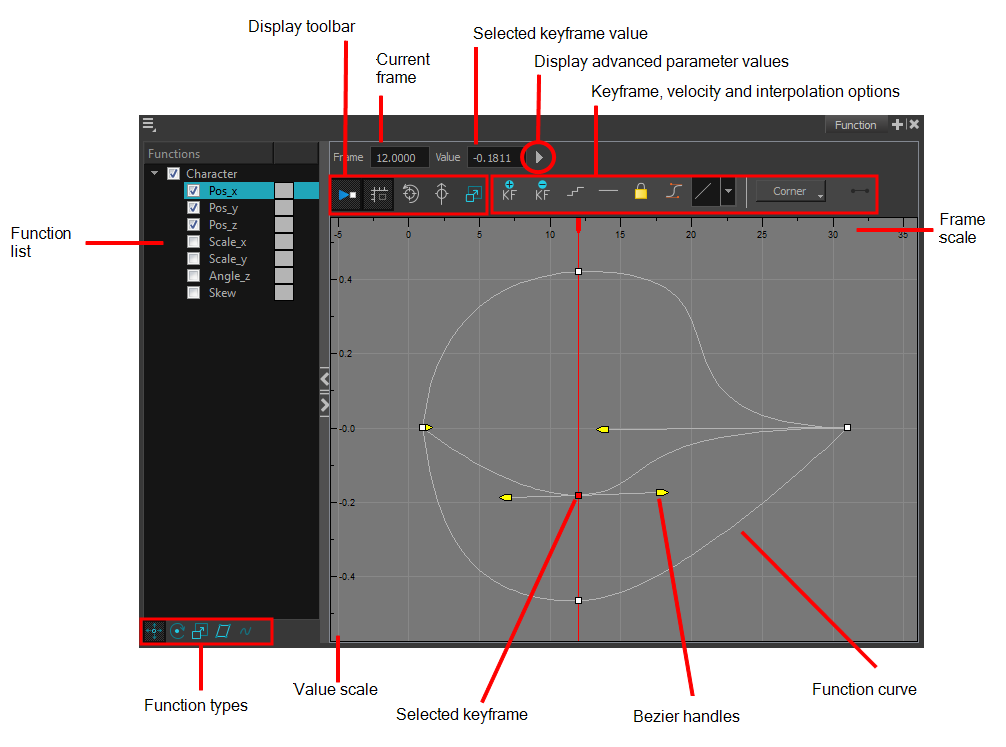
| Display Toolbar | The Display toolbar allows you to modify how the editing area is displayed. You can hide the grid, disable the synchronization with the current frame, reset the zoom level and normalize the function display by stacking them one over the other to compare them regardless of their value range. |
| Current Frame | Displays the current scene frame. |
| Selected Keyframe Value | Displays the value of the selected keyframe. |
| Display Advanced Parameter Values |
Displays the Projection, Bias, Tension and Continuity parameters to adjust the curve around the selected keyframe. |
| Keyframe, Velocity and Interpolation Options | This toolbar lets you add and delete keyframes, adjust the velocity curve, adjust the segments to motion or stop-motion keyframes and set the velocity to create steps instead of a constant progression. |
| Function Types | This toolbar lets you click on the different function types to enable or disable all the listed functions of that type. |
| Value Scale | Displays the value range for the displayed editing area. It can be referenced to know the value of a keyframe. |
| Selected Keyframe | The selected keyframe is displayed in red. When selected, the keyframe values are displayed in the corresponding fields. |
| Bezier Handles | The Bezier handles let you adjust the ease in and ease out of each keyframe. The more the handle is pulled out horizontally, the slower the animation will be. The more the handle is pulled out vertically, the faster the animation will be. |
| Function Curve | The thin line going from keyframe to keyframe is the actual curve. The section of a curve located between two keyframes is called a segment. |
| Frame Scale | The Frame Scale displays the frame range for the displayed editing area. It can be referenced to know the current frame of a keyframe. |
- In the graph of the Function editor, select a white keyframe.
The keyframe turns red and displays a pointed yellow handle.
- Drag the point up or down, or click and pull one of the handles to adjust the curve of the graph.
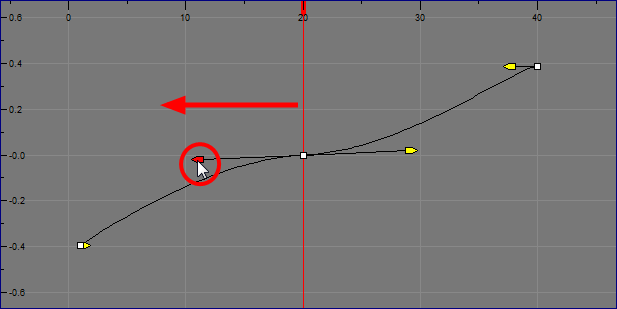
In the example above, changing the velocity from a straight line (constant velocity) to a curved one changes the ease-in (where the curve shoots up and then flattens out) and ease-out (where the curve flattens out and then shoots up) values.
The centre keyframe cannot be dragged up or down because the velocity is set. Theoretically, dragging it downwards towards zero would put it back to a place of nonmovement.
- Press the Enter/Return key with the editor still open to watch the result of your curve adjustment in the Camera view.
| 1. | In the Timeline view, open the drawing or layer’s parameters by clicking the Expand |
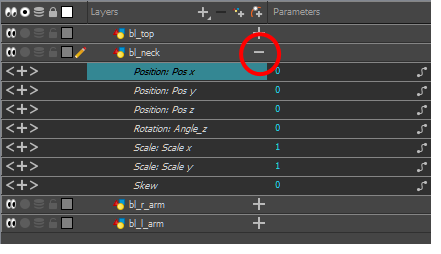
- Double-click on the parameter layer name to open the Function editor window or click once on the parameter layer to display it in the Function view.
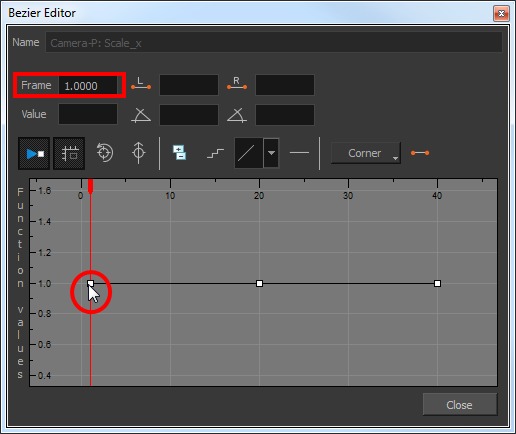
- Do one of the following:
| ‣ | In the graph section, click on the frame number where you want to make changes. |
| ‣ | In the Frame field, enter the frame number. |
In the graph, the vertical red line moves to the frame number.
- Do one of the following:
| ‣ | In the Function editor, click the Add/Remove Keyframes |

| ‣ | In the Function view, click the Add Keyframe |
- Click on the newly created keyframe and drag it up (to decrease the width of the object) or down (to increase the width of the object) or pull on the handles to create a smooth fluctuation of the drawing object's width.
- If you do not like the changes you just made, select and delete the new keyframe by pressing Delete or clicking the Add/Remove Keyframes
 button.
You can delete an existing keyframe by using the same process.
- In the Timeline view, open the peg element's parameters by clicking the Plus
 sign next the peg layer's name.

- Double-click on the parameter layer name to open the Editor window or click once on the parameter layer to display it in the Function view.
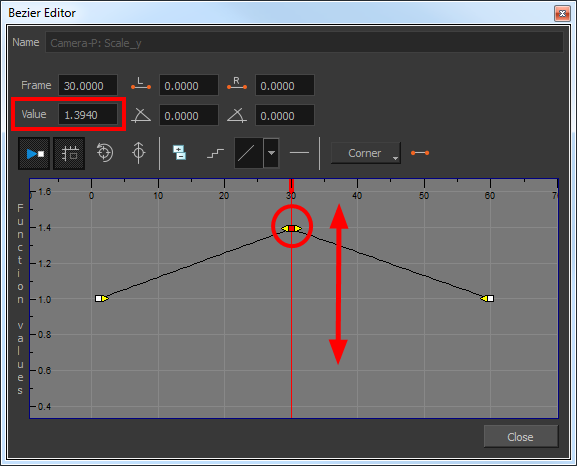
- In the Value field, enter a value. You can also drag the keyframe up or down in the graph.
- Press Enter/Return or click the Play
 button to view the changes made in the Camera view.
- Keep adjusting the values until you're satisfied with the results.
- Click Close.


