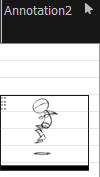
Adding an Annotation Column
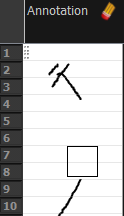
The annotation columns are useful for marking actions, corrections or other information related to your animation that you want to draw or write. This way, you can print your Xsheet, take it back to your animation table and work with the annotations.
Before you can draw in the Annotation column, you must first activate the Enable Drawing option to activate the Drawing mode. Pen tablet pressure sensitivity is not supported in the annotation column.

In the annotation column, you can type in your notes and relevant information, as well as draw sketches and ideas that will be useful in producing your animation.
Typing in an annotation column is independent from the Drawing mode. You can be in either mode and the typing will work. To learn about typing values in the Xsheet view, see Typing Exposure.
You can erase part or all of the annotation column’s text and drawn annotations. Annotations that you type in cannot be erased using this method.
You can change the pen size and colour when you draw in the annotation column.
When working with the annotation columns, it is useful to display tick marks on odd-numbered frames.
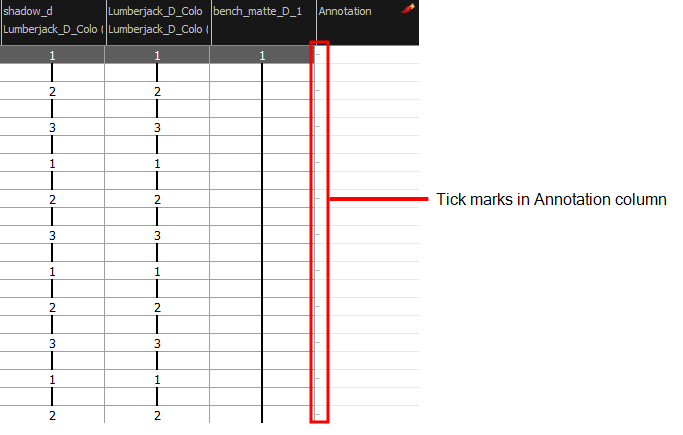
To display the tick marks, you must run a short script.
If you scanned your paper exposure sheet’s annotations or if you need to place some pictures or drawings in the Annotation columns, you can easily import them.
- Do one of the following:
| ‣ | In the Xsheet menu, select Columns > Add Columns. |
| ‣ | In the Xsheet toolbar, click the Add Columns |
| ‣ | Press Shift + C. |
The Add Column dialog box opens.
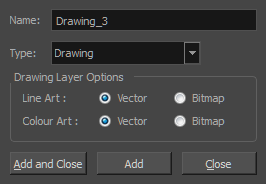
- In the Name field, type in an appropriate name.
- From the Type list, select Annotation and click OK.
The new column appears.
- Do one of the following:
| ‣ | In the Xsheet menu, select Annotation > Enable Drawing. |
| ‣ | In the Annotation column header, click the icon in the upper-right corner to cycle through the icons until the Brush |
The Drawing mode is enabled.
- To draw in an Annotation column, simply use your mouse or pen tablet.

- Do one of the following:
| ‣ | In the selected cell, press Ctrl (Windows/Linux) or ⌘ (Mac OS X). |
| ‣ | In the selected cell, hold down Ctrl + Shift + click (Windows/Linux) or ⌘ + Shift + click (Mac OS X). |
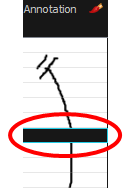
- In the selected cell, type the desired text.

- In the annotation column header, click the icon in the upper-right corner to cycle through the icons until the Eraser
 icon is displayed.
- In the column, click and drag the cursor on top of the drawn annotation to erase parts of it.
NOTE: When using a pen on a tablet, you MUST flip your pen to the eraser side for the eraser to work.
- In the Xsheet menu, select Annotation > Pen Width and do one of the following:
| ‣ | Select a pen width preset. |
| ‣ | Select Change Current to display the Pen Width dialog box. In the Pen Width field, type the number of pixels for the pen size and click OK. |

- In the Xsheet menu, select Annotation > Change Pen Colour.
The Select Colour dialog box opens.
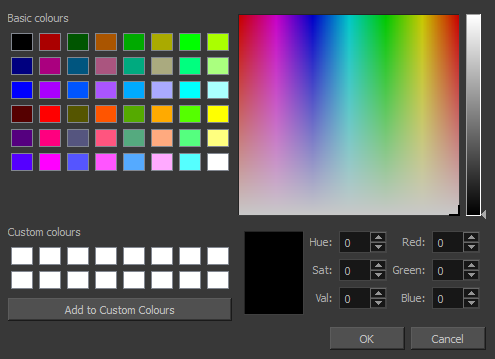
- Choose a new colour.
- Click OK.
- From the top menu, select Windows > Script Editor.
- From the Script Editor menu, select File > New Script.
- Type in a name for your script and click OK.
- In the File list, select the script you created.
- On the right side of the view, type the following script:
function display_tick_marks()
{
preferences.setBool("XSHEET_ANNOTATION_FRAME_MARKER", true);
MessageLog.trace( preferences.getBool("XSHEET_ANNOTATION_FRAME_MARKER", false));
}
- Click Verify.
The script is verified.
- From the Script Editor menu, select Play/Debug > Run.
A dialog box opens with your script selected in the Files column.
- In the Functions column, select display_tick_marks and click OK.
Tick marks appear on odd frames in the Annotation column. If you do not see tick marks, close and restart Harmony.
- Follow steps 1 to 5 of How to display tick marks and use the following script:
{
preferences.setBool("XSHEET_ANNOTATION_FRAME_MARKER", false);
MessageLog.trace( preferences.getBool("XSHEET_ANNOTATION_FRAME_MARKER", false));
}
- Follow steps 6 to 8.
All tick marks are removed from the Annotation column.
- In the Xsheet view, select the first cell in the Annotation column where you want the imported image to start.
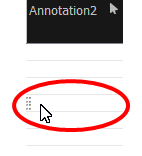
- Do one of the following:
| ‣ | Right-click on the cell and select Annotation > Import File. |
| ‣ | From the Xsheet menu, select Annotation > Import File. |
- Browse for the bitmap image to import.
- Click Open.
The image appears in the Annotation column.
